


Is your institution prepared for the census tract changes expected for 2027? Every five years, the Federal Financial Institutions Examination Council (FFIEC) changes the source of the census data used for compliance reporting, resulting in changes to census tract classifications that can materially alter a lender’s fair lending and Community Reinvestment Act (CRA) performance profile beyond any changes in market conditions or lending strategy.
These shifts are systemic and occur independent of a lender’s actions; yet they directly affect how performance is measured by regulators. Understanding and preparing for these changes is an important element of a proactive compliance management system.
A Structural Shift in Performance Measurement
Each year the Census Bureau releases a new version of the five-year American Community Survey (ACS), providing annual snapshot data on demographic, housing, economic, and social patterns at the census tract level. The FFIEC updates the ACS version used for fair lending and CRA compliance reporting every five years. The most recent update occurred in 2022, moving from the five-year ACS covering 2011 through 2015 (the 2015 ACS) to the ACS covering 2016 through 2020 (the 2020 ACS). The next change is expected to occur in 2027, after the Census Bureau releases the ACS covering 2021 through 2025 (the 2025 ACS).
From a compliance perspective, these census data updates affect two key dimensions of geographic-based compliance:
- Low- and Moderate-Income Census Tracts (LMICTs)
- Majority-Minority Census Tracts (MMCTs) and their derivatives (Majority-Black Census Tracts, Majority-Black and Hispanic Census Tracts, etc.)
These designations form the foundation of CRA and redlining risk performance evaluations. As tract boundaries are redrawn after each decennial census and demographic data shifts every year, the compositions of these dimensions change. For some lenders, this change can lead to an apparent decline in performance metrics, even if lending patterns remain constant. Most importantly, for all lenders, these patterns will affect every lending market. All Metropolitan Statistical Areas (MSAs) can expect modest to substantial changes in the composition of census tracts by income or demographic composition. Thus, lenders that performed well from a CRA or redlining perspective in recent years may see significant increases or declines, relative to peers, based on these structural geographic changes.
To understand how these changes may impact your institution, consider these examples of changes from the 2020 ACS versus the most current ACS covering 2020 through 2024.
The map in Figure 1 shows the percentage of total census tracts in each MSA that are projected to change their LMICT or MMCT classification based on the 2020 ACS versus the most current ACS covering 2020 through 2024 (the 2024 ACS). These trends reflect the exposure of lenders nationwide to meaningful shifts in geographic performance measured in CRA and fair lending .
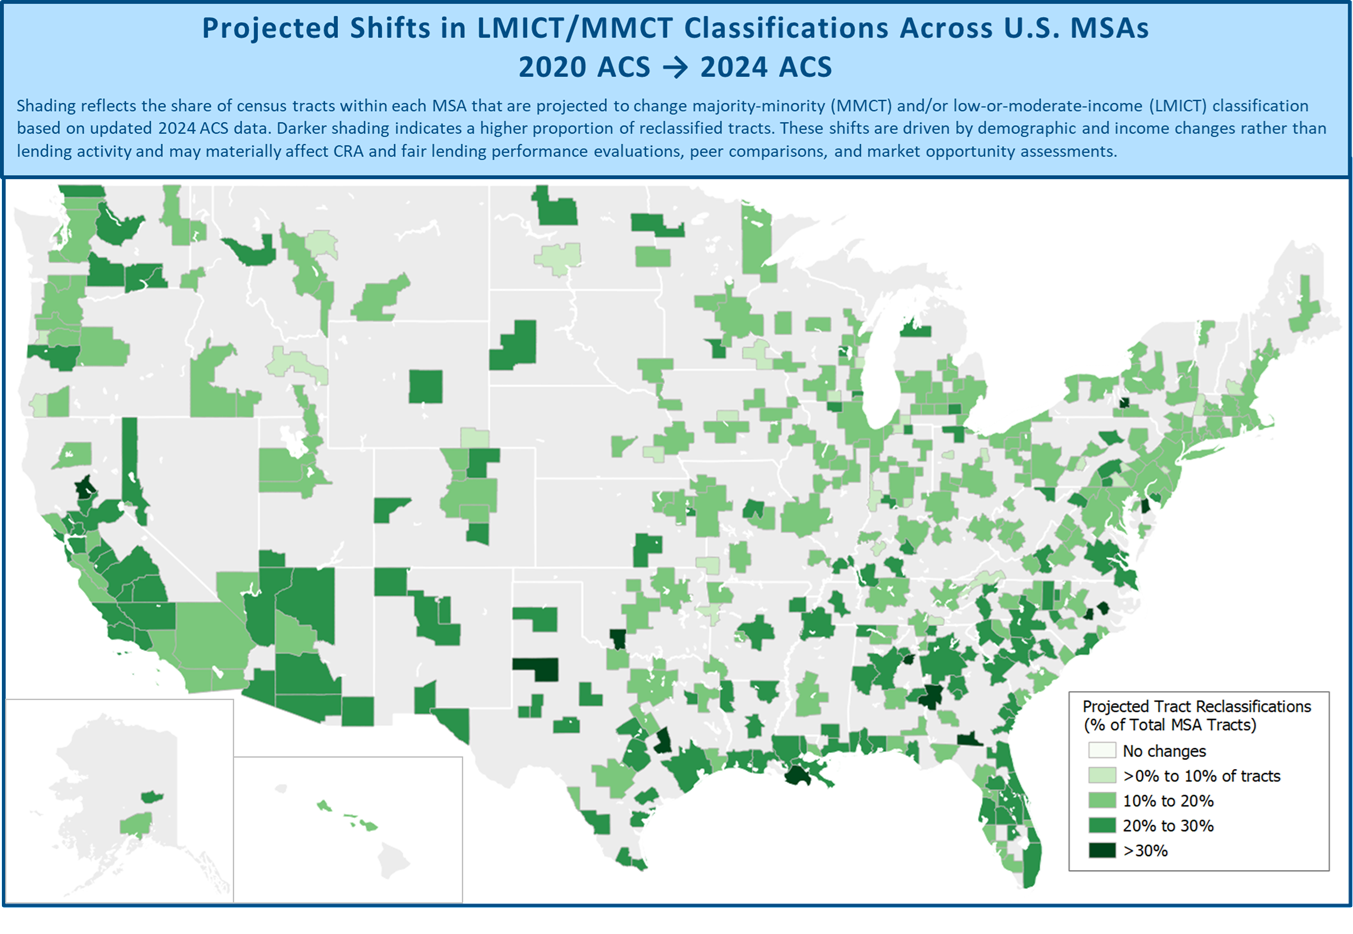
Figure 1. Current Trends in Income and Demographic Reclassifications (click image for more detail)
An Illustration: Trends in the Charleston-North Charleston, SC MSA
An example of the effects of the changes can be observed in the historic changes in the Charleston-North Charleston, SC MSA (Charleston). This lending market has been among the most dynamic in the nation since the 2020 census, with substantial shifts in the demographic composition concentrated in specific regions. Figure 2 shows how the current trends in minority residential patterns can lead to the reclassification of several census tracts from MMCTs to non-MMCTs, and vice versa.
Assuming 2024 ACS demographics, the number of MMCTs in Charleston will increase from 46 census tracts to 51 census tracts, with 13 census tracts changing their MMCT status. Lenders that have an elevated or limited presence in the more dynamic regions of Charleston may experience significant shifts in the concentration of lending to MMCTs in 2027 without making any changes in their lending strategy.

Figure 2. Trend in MMCT Reclassifications, Charleston-North Charleston, SC MSA (click image for more detail)
Figure 3 demonstrates the wide variation that Charleston-area lenders may face based on these systemic demographic shifts. Assuming 2024 geographic mortgage lending patterns reported under the Home Mortgage Disclosure Act, most of the top 30 lenders in the market would have reported materially higher MMCT lending activity based on the latest demographic patterns. However, several lenders present with less positive changes, or even negative shifts in MMCT lending activity, potentially creating a disconnect between their established footprint and demographic trends that can create new compliance risks.
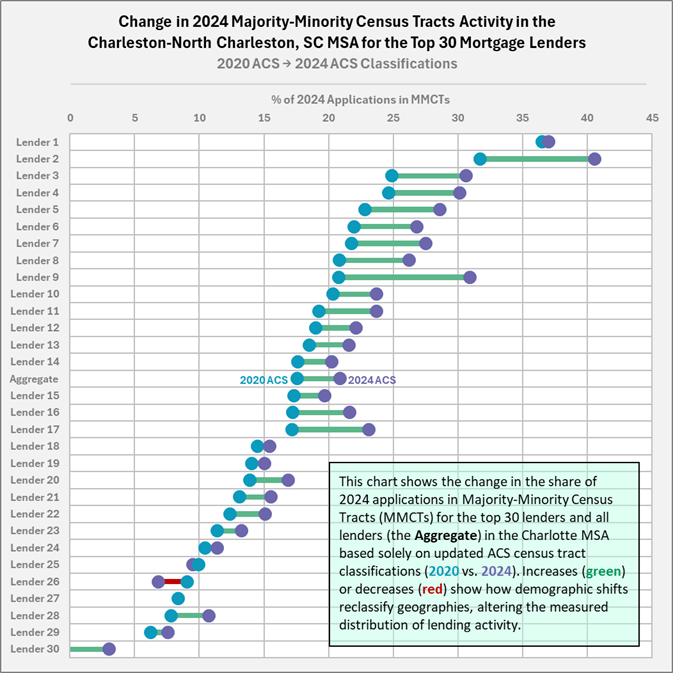
Figure 3. Change in 2024 MMCT Classifications for Top 30 Lenders in the Charleston-North Charleston, SC MSA (click image for more detail)
Key Risk Implications for Lenders
For CRA and fair lending compliance teams, census tract reclassifications introduce several distinct risks:
- Redlining Risk Volatility. Peer comparisons are recalibrated based on the updated demographics. A stable lending pattern may appear weaker if peer activity shifts more quickly into newly designated minority communities.
- CRA Performance Pressure. LMICT lending ratios may decline as the number of qualifying tracts increases in or expands beyond a lender’s footprint. This decline can affect both Lending Test conclusions and broader performance narratives.
- Assessment Area Scrutiny. Newly designated LMICTs and MMCTs just outside of defined market areas can create new areas of scrutiny regarding assessment area delineations and the need for broader reasonably expected market areas (REMA) in redlining analyses.
- Community Development Qualification Challenges. Activities planned under current tract definitions may no longer qualify when a loan or project closes, creating execution risk for pipelines of community development deals and investments.
Preparing for the Shift
While tract reclassifications are outside of a lender’s control, their impact can be managed with proactive analysis and planning. Institutions should consider:
- Re-benchmarking performance metrics using the most recent census data
- Evaluating gaps in coverage relative to emerging LMICTs and MMCTs
- Revisiting assessment area delineations and potential REMAs for consistency and defensibility
- Assessing pipelines of community development activities to ensure continued eligibility
- Incorporating the five-year census data adjustments into ongoing monitoring frameworks
Census-driven changes represent an infrequent but substantial reset in how geographic lending performance is measured. Institutions that recognize that shift early and adapt accordingly will be better positioned to manage regulatory expectations and underlying compliance risk.
Authored by Jonathon Neil

